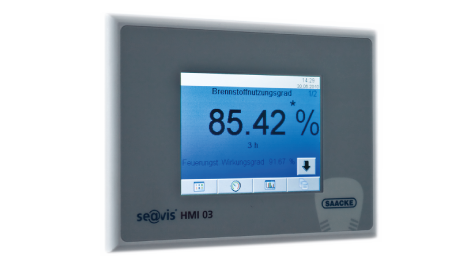
se@vis efficiency monitor

The main points
- Fast and reliable analysis and visualization of your plant's operating profile
- Transparent representation of all measured value including fuel efficiency
- Simulation of optimization potentials
- Detailed calculation of savings potentials
- Long-term data logging ensures sustainable transparency
- Useful results even after one week for typical operation
- Suitable for all burners and plants
- Easy to mount
- Intuitive operation
Efficiency through transparency
Each plant used to produce heat has its own separate operating profile due to the interaction between heat requirement and energy consumption. This profile must be known to develop, evaluate and exploit potential savings. It is the basis for calculating investment in energy optimization.
This is where the seavis efficiency monitor can be used. It "observes" the plant, creates and visualizes a precise and transparent operating profile, thereby exposing possibilities for saving energy. Savings of more than 10% are not unusual.
Generally a single input signal is sufficient for the analysis: The efficiency monitor, which can be installed in just a few simple steps, records this signal and combines it with known data from the approval and measurement report. With additional real-time signals for burner capacity, fuel flow rate, flue gas temperature or O2 content, the calculation becomes even more precise. Transferring data from the related control systems seavis compact or pro is especially simple. All that is needed is an Ethernet cable to use control data for the efficiency calculation as well.
The seavis efficiency monitor can make a wealth of data and analyses available at the press of a button after just a short time. In addition to a chronology of all recorded values, it offers in particular the fuel efficiency factor of the last 3 or 24 hours. This efficiency metric is frequently well below its potential, a direct result of accumulated energy losses in operation. In the analysis the efficiency monitor lists these losses in detail and quantifies the results, for example of radiant heat loss, too frequent burner starts, flue gas temperature too high or unnecessary blowdown and blow-out. Potential faults (for example leakage) can be discovered in this way and prevented in advance.
In the next step the seavis efficiency monitor simulates possibilities for optimization. In this manner an economizer, continuous blow-out control or speed control can be installed in the plant virtually, for example, and the resulting changes in energy consumption can be calculated exactly. In this case also, the actual operating profile is used and possible savings are available in quantified format at the press of a button. The data provided by se@vis efficiency monitors can be used to build watertight arguments for investment decisions under consideration.